East London is a place I have watched change over more than a decade of commuting to the University of East London, where I teach architecture and urbanism. Suspended above the ground, the DLR carries you across the many cities – as I often tell my students – that make up London.
In a six-mile strip, you glimpse the traces of the nineteenth-century industrial city, with its few remaining warehouses and workers’ tenement; patches of the post-war modernist city, still breaking the skyline; and today’s market-led developments – some more fortunate than others – alongside increasingly privatised public spaces, all pressed together along the same route. Between rivers, rails and pylons, waterways and strips of green space weave through these overlapping cities, while boarded-up brownfields wait for futures not yet decided. I must confess that City Island, with its colourful ceramic-clad buildings, still catches my eye against the shifting tides of the River Lea. The journey would make a good travel quiz for architectural connoisseurs. I keep forgetting to test it on my students.
For anyone interested in architecture and urban change, this is fascinating. The scale and ambition of East London’s regeneration agenda is monumental. From above, the city’s complexity seems to unfold like an open book. But cities are more than just buildings, the spaces that separates them and the infrastructures that connect them. They are also shaped by everyday practices, local knowledge, histories of migration and displacement, inequality and hope. Sometimes those stories sit comfortably together. More often, they collide.
Reading the city at this scale cannot be done from above alone – whether from the DLR, through policy documents, or through abstract architectural drawings. These perspectives are useful. Planning depends on data: housing numbers, transport flows, environmental risks, economic forecasts. Without this kind of information, it would be impossible to plan services, understand pressure points or make decisions at scale.
Essential as they are,these forms of data do not fully reveal the city as lived experience. They show the scale of transformation, but rarely its consequences.
Who is affected when an area changes? What kinds of support already exist locally? Which places do people rely on, and where do they feel pushed out? What is being lost, what is being made possible, and who gets to decide?
These questions point to another way of knowing the city: one that is harder to measure, and equally important. It is found in the route people take because the main road feels unsafe, the missing bench that makes a walk difficult for older residents, the corner shop people rely on for help as much as for groceries, or the fenced-off site where neighbours see the possibility of a garden, playground or meeting place. These are not irrelevant ‘data’. They are part of the real infrastructure of everyday life.
Participation offers one way of approaching this knowledge, although the word itself has become tired. Too often, participation means consultation: a meeting, a survey, or a tick-box exercise within a planning process whose direction has already been decided. Yet participation can also mean something more ambitious. It can be a way of learning from the people who know a place best.
After all, who knows a place better than those who live there, work there, commute through it, raise children there, or walk its streets every day? What would happen if this everyday knowledge could be made visible? Could it help communities make stronger claims about what matters, and shape better decisions about local change?
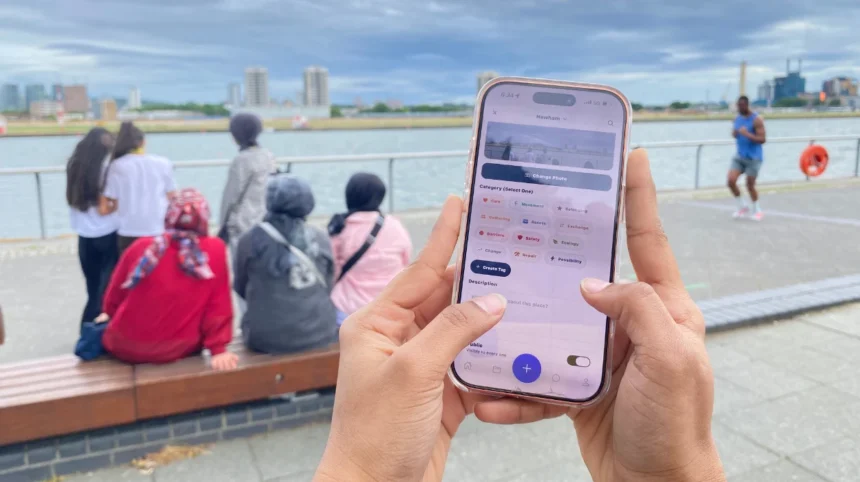
Seven months ago, I began a project that tries to answer these questions. Working with a group of MSc Computer Science graduates at the University of East London, we built Cartogrammm: a digital mapping platform that could support communities, local authorities, researchers and civic organisations to document place-based local knowledge. The aim was to produce a tool that could build a better picture of how the city is lived and experienced and help drive more grounded, context-sensitive decision-making processes. Its name stands for maps made by many.
The platform allows people to add geolocated entries – images, short notes and tags as they move through the city: where they go, what they value, what they notice, what concerns them, and what they imagine could change. The idea is simple: if many people contribute small pieces of local knowledge, a richer collective picture can begin to emerge. Not a map made from above, but a map built from lived experience.
The platform is still in its beta version, and we are now beginning to test it in North Woolwich through a pilot project called The Resilient Map.
North Woolwich is an important place to begin. It has a strong local history and a distinctive position in East London. It sits between the River Thames and the Royal Docks, encompassing London City Airport and the Tate & Lyle sugar refinery, in a wider flood-risk landscape. Connected to major systems of transport, industry and development, it is often experienced as physically close yet spatially set apart from the rest of the city. It is also a neighbourhood at a critical moment, with regeneration plans expected to be announced in September. Like many parts of East London, its official story does not always capture what people know from the ground.
The Resilient Map invites residents and others who know North Woolwich well to document the places, practices and relationships that support local life. It starts from the premise that resilience is not something communities simply have or lack. It is produced through local knowledge, everyday routines, places of care and informal networks that often remain overlooked in planning, research and decision-making.
In this project, resilience does not mean simply coping with crisis. It means recognising the local strengths that already exist within a place: the ways people support one another, navigate difficulty, adapt to change and imagine different futures. The pilot asks how these strengths can be made visible and turned into shared knowledge that communities can recognise, strengthen and act upon.
The pilot is being developed in collaboration with ReSpace at REinsTATE, the former Tate Institute, and supported by the University of East London’s Institute for Connected Communities. It begins with a workshop on Saturday 20 June, followed by a period of mapping and a second session on 4 July to reflect on what has been collected and what it might reveal about North Woolwich.
We will share what emerges from the pilot in a future article. For now, the invitation is also open to other communities, local organisations, resident groups and civic initiatives that might want to try something similar. Cartogrammm is still being tested, but its ambition is clear: to help communities show what they already know about the places they live, and to make that knowledge work.
When I next take the DLR to Cyprus after the 4 of July, I will still look out at the familiar landscape of towers, rivers, railways and sites waiting for change. But I will also be thinking about another kind of map: one made from the ground up. A map that helps us read East London not only as a landscape of growth, infrastructure and transformation, but as a living geography of belonging, resilience and possibility.
Because the people who live in a place know what matters best.