If you want to understand how local tax money is distributed, the “Fair Funding” tracker is best treated as a public accountability lens: it shows how central and local government funding formulas shape what residents ultimately pay for, from adult social care to housing and community services. For an East London audience, this matters because borough budgets are heavily influenced by funding reforms, and those reforms can affect council tax, service levels, and the resources available to local communities.
Why the tracker matters
Most people know they pay council tax, but fewer know how that money sits inside a much bigger system of local government finance. The Fair Funding framework is designed to assess relative need and resources across local authorities, helping decide how public money is allocated between areas. In practice, that means the tracker is useful for seeing why one borough may receive more or less support than another, especially when demand for services differs because of population, deprivation, housing pressure, or social care needs.
For readers in East London, this is especially relevant because London boroughs have long argued that funding formulas do not always reflect the real costs of delivering services in dense, fast-changing urban areas. The tracker helps make that argument visible by translating a technical funding debate into something residents can inspect, compare, and question.
What the Fair Funding tracker is
A Fair Funding tracker is essentially a public-facing way to follow how local authority funding is assessed and redistributed. The Government’s Fair Funding Share Calculator is intended to determine each local authority’s share of England’s total funding based on assessed need and resource levels. The Local Government Association has also published modelling tools to help councils evaluate how proposed funding approaches might affect them.
That means the tracker is not a tax receipt in the narrow sense. It is a way to understand the policy logic behind where public money goes, how formulas are built, and why funding can differ from place to place. For citizens, it can help answer a more practical question:
“Why does my council have the budget it has, and what does that imply for the services I receive?”
Start with your council tax bill
The easiest place to begin is your council tax bill or online council tax account. Councils normally set council tax for each financial year from 1 April to 31 March, and bills are issued with the amounts due for the year ahead. Some councils also provide online account access so residents can view billing details digitally.
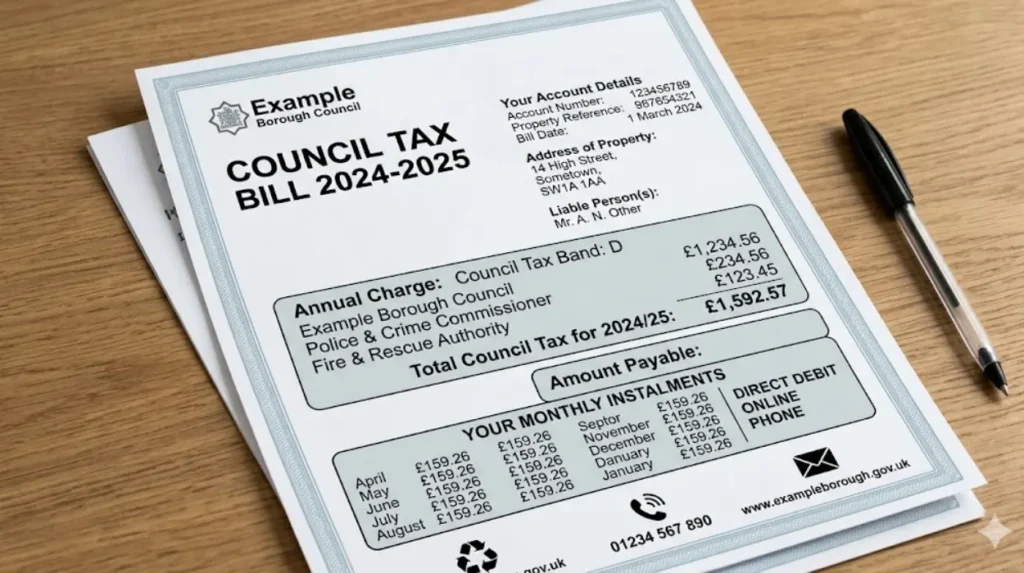
Once you have your bill, identify the council tax band, the annual charge, and the local authority named on the notice. That gives you the starting point for comparing your local contribution with the funding picture shown in the tracker. If you live in outer East London, this also helps you compare boroughs that may look similar on paper but have different demographic pressures and service needs.
Find the relevant funding view
To use the tracker properly, look for the specific authority or borough you want to investigate. The Government’s Fair Funding Share Calculator is designed to show a local authority’s share of national funding based on its relative need and resources. The LGA’s modelling tools are aimed at showing how proposals might affect member authorities and can support side-by-side analysis of different local government funding approaches.
If you are writing for residents, the most useful approach is to compare your borough with nearby East London areas and with boroughs that have different profiles. That lets you see whether the formula rewards higher service demand, recognises deprivation, or underestimates the cost of delivering services locally. In a borough-level story, that comparison often reveals more than a standalone figure ever could.
Read the numbers carefully
The key to the tracker is understanding that “funding” is not the same thing as “tax paid.” Council tax is only one part of local government finance, and the tracker is usually about the distribution of public funding, not a live account of every pound a resident contributes. That distinction matters because residents often assume their council tax should directly match local service spending, when in reality councils work within a wider settlement that includes grants, formula allocations, and central policy choices.
When you see a borough’s funding amount or share, ask four questions. First, how much of the total is being driven by relative need? Second, how much reflects local resource capacity? Third, does the formula account for social care and deprivation pressures? Fourth, is the figure likely to change under future reforms? These are the issues that sit behind the Fair Funding review and its successor proposals.
What London residents should watch
London is often discussed as one place, but borough finances differ sharply. Recent reporting on fairer funding has highlighted that outer London boroughs can benefit when formulas better reflect local need, while some inner London authorities may face weaker settlements depending on the design of the reforms. In Redbridge, for example, local leaders presented fairer funding as a major budget breakthrough tied to lobbying on behalf of residents.
That makes the tracker especially useful for East London readers who want to know whether their borough is gaining or losing from the way funding is being recalculated. It also helps explain why council leaders spend so much time arguing over “fairness” in funding debates: small formula changes can translate into large operational differences in social care, housing support, education, and public safety. If a borough’s funding rises, that does not automatically mean residents will see lower council tax, but it may prevent service cuts or support a freeze.
How to interpret fairness
Fair Funding sounds simple, but in public finance it usually means “fair according to the formula,” not necessarily “fair according to every resident’s lived experience.” The current government’s approach to reform is built around assessing relative need and resources, which is a technical way of saying that some areas require more support because their costs or demands are higher. That is why funding debates often become politically charged: different boroughs can point to different kinds of fairness and both can be defensible.
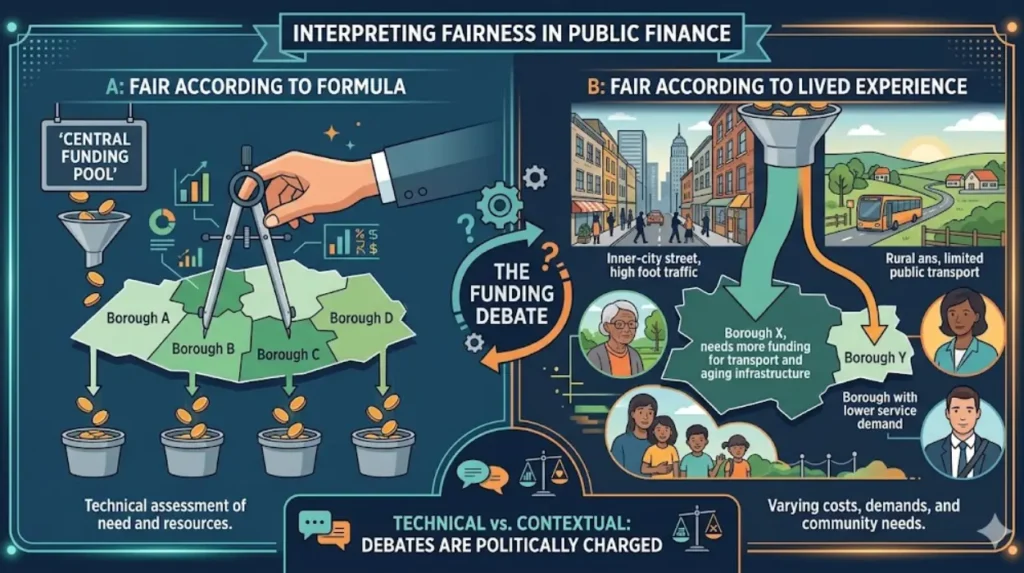
For a resident, the smartest reading is to treat the tracker as evidence of how government thinks local need should be measured. If the outputs do not match what people see on the ground, that gap becomes the story. In other words, the tracker is not just a spreadsheet; it is a window into the assumptions shaping local public services.
A simple way to use it
Begin by checking your borough’s council tax information and annual accounts, which can show how council tax revenue is divided and where the money goes. Then compare that local picture with the funding share or modelling information published through official fair funding materials. Finally, compare your borough with nearby councils in similar or contrasting circumstances to see whether the formula appears to reward higher need, better local revenue capacity, or a particular policy priority.
This process turns an abstract finance story into something residents can follow. A good local article can explain that a family’s tax bill is not simply “spent next door,” but flows into a broader settlement in which the Government, the council, and the Greater London Authority all play different roles. Once readers understand that structure, the tracker becomes much easier to interpret.
What residents can do next
If you are a resident, the tracker should prompt three practical habits. First, check your council tax bill and understand the council year cycle from April to March. Second, compare your borough’s funding position with nearby areas using official fair funding materials. Third, follow council budget announcements to see whether funding changes are improving services, protecting them from cuts, or simply keeping them stable.
If you are a journalist or editor, the best use of the tracker is to connect formula changes to real-life outcomes. Show readers whether the borough has more money for social care, whether council tax is frozen or rising, and whether the local authority says funding fairness has changed its budget choices. That is the point where a technical tracker becomes a public-interest story.
The bigger picture
The Fair Funding tracker is ultimately about transparency. It helps residents move beyond headlines about council tax rises or budget squeezes and understand the system behind them. For East London communities, where demand for services and pressure on local government can be intense, that understanding is especially important.
Used well, the tracker does not just tell people where their tax goes. It shows how government decides what counts as fair, which boroughs benefit from that decision, and what those choices mean for everyday public services.